Why Greencoat and ORIT lowered their long-term wind generation
Greencoat UK Wind and ORIT have both lowered their long-term generation expectations, with a direct hit to NAV. What each fund changed, and what any such change rests on.
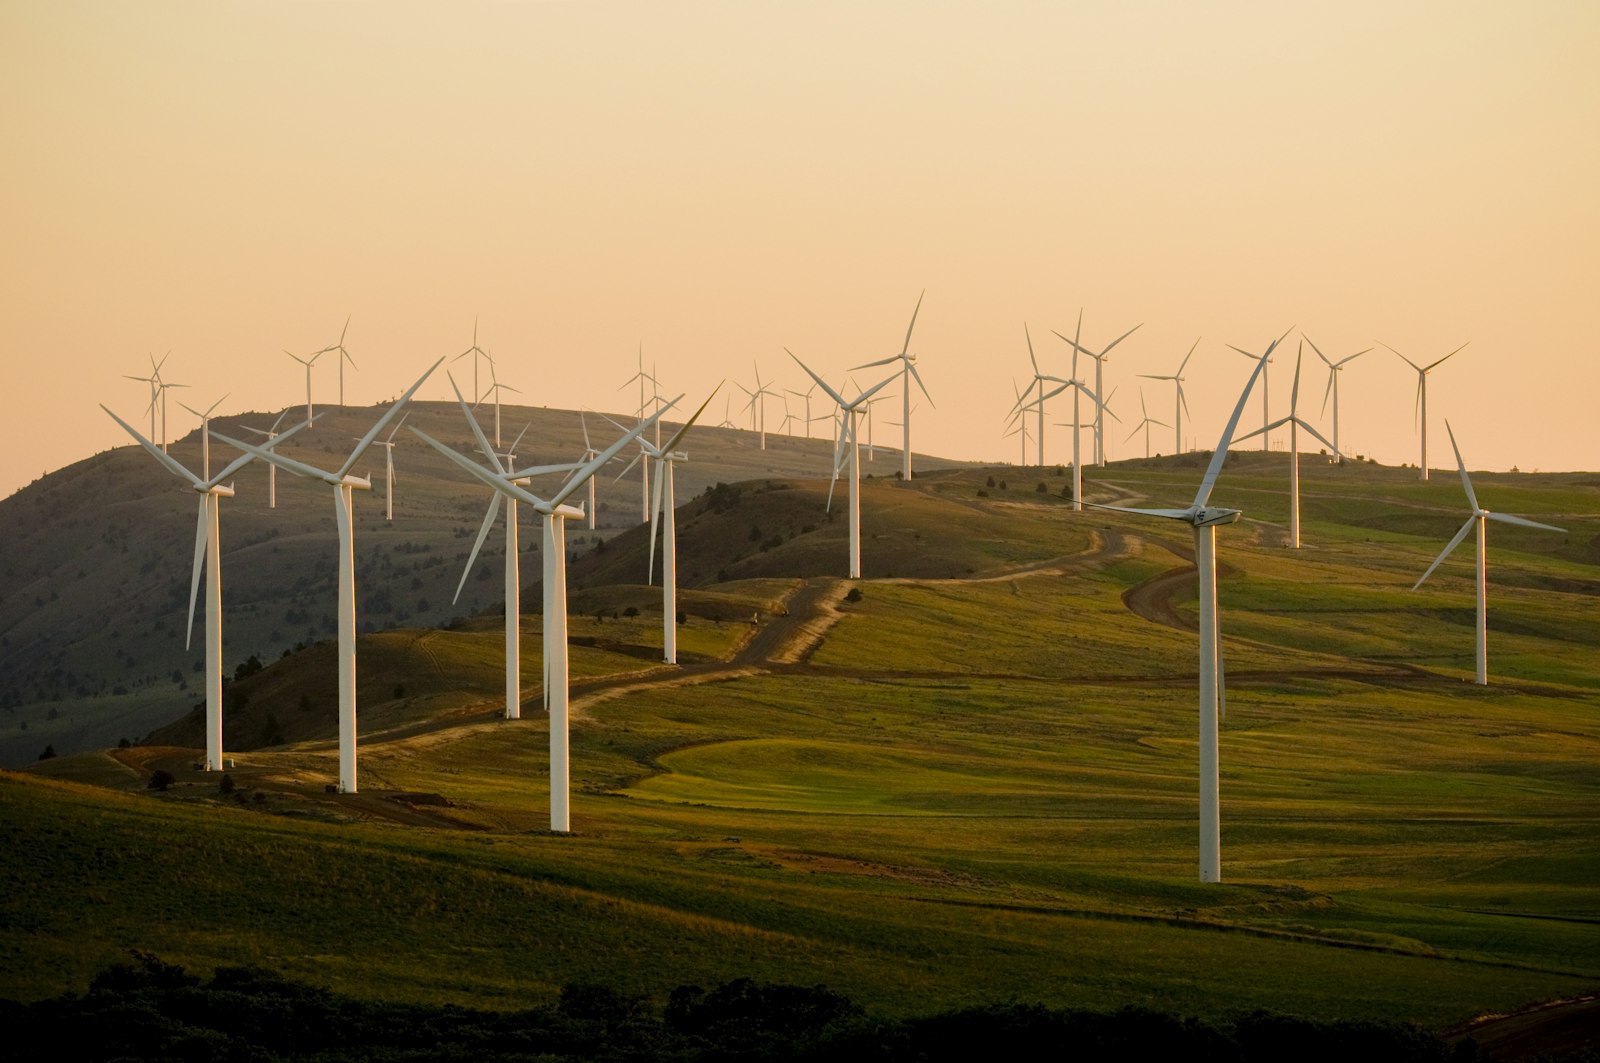
Two UK-listed funds that own wind farms have lowered their long-term generation expectations in their published accounts, and both took a direct hit to net asset value. Greencoat UK Wind lowered its expectations by 2.4%, and Octopus Renewables Infrastructure Trust (ORIT) lowered those of its operational onshore wind portfolio by 4.7%. Owners who are thinking about shaving a few percent off the average for 2027 can now see the same step taken in public, with numbers attached. The open question is how large such a step should be, and that depends on whether recent weak years are cyclical or structural.
Key takeaways
- Lower generation expectations now show up in published NAVs. Greencoat’s energy yield line in the NAV bridge came to -£146.8m, and ORIT’s review to -£30.4m.
- The two funds got there by different routes. Greencoat updated its long-term wind data set, and ORIT moved from pre-construction forecasts to assumptions based on operating data.
- The right size of a change depends on a question the data alone can’t answer. Telling whether recent weak years are a cycle or a shift takes the long wind record and an outlook, site by site.
What Greencoat changed, and why
In its annual report for 2024, Greencoat UK Wind harmonised its long-term wind correlation data set with an expert third party. That added recent years to the data set, and those years were below the long-term UK average, so the long-term average itself came down. In the fund’s words, this resulted “in a 2.4 per cent reduction in long term generation expectations”.
At the end of 2024, the portfolio consisted of 49 operating UK wind farms, onshore and offshore, totalling 1.983 MW. The energy yield line in the NAV bridge came to -£146.8m, or -6.5p per share. The fund budgets on a 30-year estimate, and the same report gives the scale of normal variation: the annual standard deviation of wind speed is 6%, and that of generation 10%.
What ORIT changed, and why
In its interim report for the first half of 2026, published on 22 September 2026, ORIT reviewed the long-term energy yield assumptions of its operational onshore wind portfolio and replaced the remaining pre-construction forecasts. The review drew on operating data, updated technical analysis, long-term weather information and engineering judgement. ORIT owns 740 MW across 39 assets in five countries, mostly solar, with onshore wind at 24% of capacity (as of 30 June 2026). Expected long-term generation for that portfolio fell by 4.7% in total, from 1.348.020 MWh to 1.284.381 MWh a year. The fund describes the update as one to “structural, long-term generation expectations rather than an adjustment for short-term weather variability”.
The change differed widely by country:
| Country | Change in long-term generation |
|---|---|
| UK | -3.8% |
| Ireland | 0.0% |
| France | -1.8% |
| Finland | -8.2% |
| Germany | -21.5% |
The German figure rests on a single 35 MW wind farm, Leeskow, which has been operating since September 2022, so a large percentage change sits on a small base and less than four years of operating history. The report doesn’t break the change down further.
The NAV impact was -£30.4m, or -5.8p per share, with the largest effects in Germany (-£10.8m) and Finland (-£10.2m). ORIT’s offshore and solar assumptions were not changed.
What a change like this rests on
Both funds moved their baseline by changing the data underneath it. A longer data set that includes recent weak years pulls the long-term average towards them. Operating data replaces a pre-construction estimate with what the sites have actually delivered since they started, which mixes the wind with availability, curtailment and grid constraints.
Either way, the new baseline gives recent years more weight. Neither route on its own says whether those years were a cycle that will even out or the start of a shift in the wind at the sites. Greencoat’s own figure shows why that matters: with a standard deviation of generation of 10% a year, a few years can sit well below the long-term average by chance. A few years of operating data, less than four in ORIT’s German case, can’t separate that from a real change, and the answer decides whether a lower baseline is the right size, too small or too large.
That question has a direct cost on both sides. Expectations set lower than needed hold back a valuation for no reason. Expectations that stay too high lead to further misses, one of the reasons infrastructure funds have underperformed.
The checks before you shave
Before shaving a few percent off the average, three things help size the change. Separate the wind part of a shortfall from outages, curtailment and prices, since only the wind part belongs in a long-term wind baseline. Place the recent weak years in each site’s long wind record to see whether they fall inside the range of past bad years. Then add a forward outlook on top of the standard P50 timeframe, so the baseline reflects the wind the sites are likely to get rather than only the wind they had.
We describe these checks in more detail in Cyclical or structural?. For fund managers, the same analysis feeds into deal pricing and portfolio decisions, which we cover on our page for infrastructure investors.
Frequently asked questions
Why did Greencoat UK Wind lower its long-term generation expectations?
Greencoat harmonised its long-term wind correlation data set with an expert third party, which added recent years that were below the long-term UK average. The result was a 2.4% reduction in long-term generation expectations and a £146.8m energy yield effect on NAV, according to its 2024 annual report.
How much did ORIT lower its onshore wind generation expectations?
ORIT lowered the long-term generation of its operational onshore wind portfolio by 4.7% in total in its interim report for the first half of 2026, after moving from pre-construction forecasts to assumptions based on operating data. The change ranged from 0.0% in Ireland to -21.5% in Germany, where it rests on a single 35 MW wind farm, with a NAV impact of £30.4m.
How do you know how much to lower a wind generation forecast?
Separate the wind part of a shortfall from operational and market losses, then compare the recent weak years with each site’s long wind record and add a forward outlook. Whether the dip is cyclical or structural decides whether a lower baseline is needed at all, and how large it should be.
Find out for your sites
Book an intro call with us - and within 48 hours of our conversation, you’ll see how your sites’ last years compare with their long wind record.
The climate data your financial models are missing.
Get climate intelligence on your portfolio - in 48 hours.
Book a Call